Dutch Supermarkets Count Their Food Waste in Public
Dutch supermarkets waste under 1 percent of the food they buy and a university publishes it. I compare US grocers and ask what Philadelphia could count.
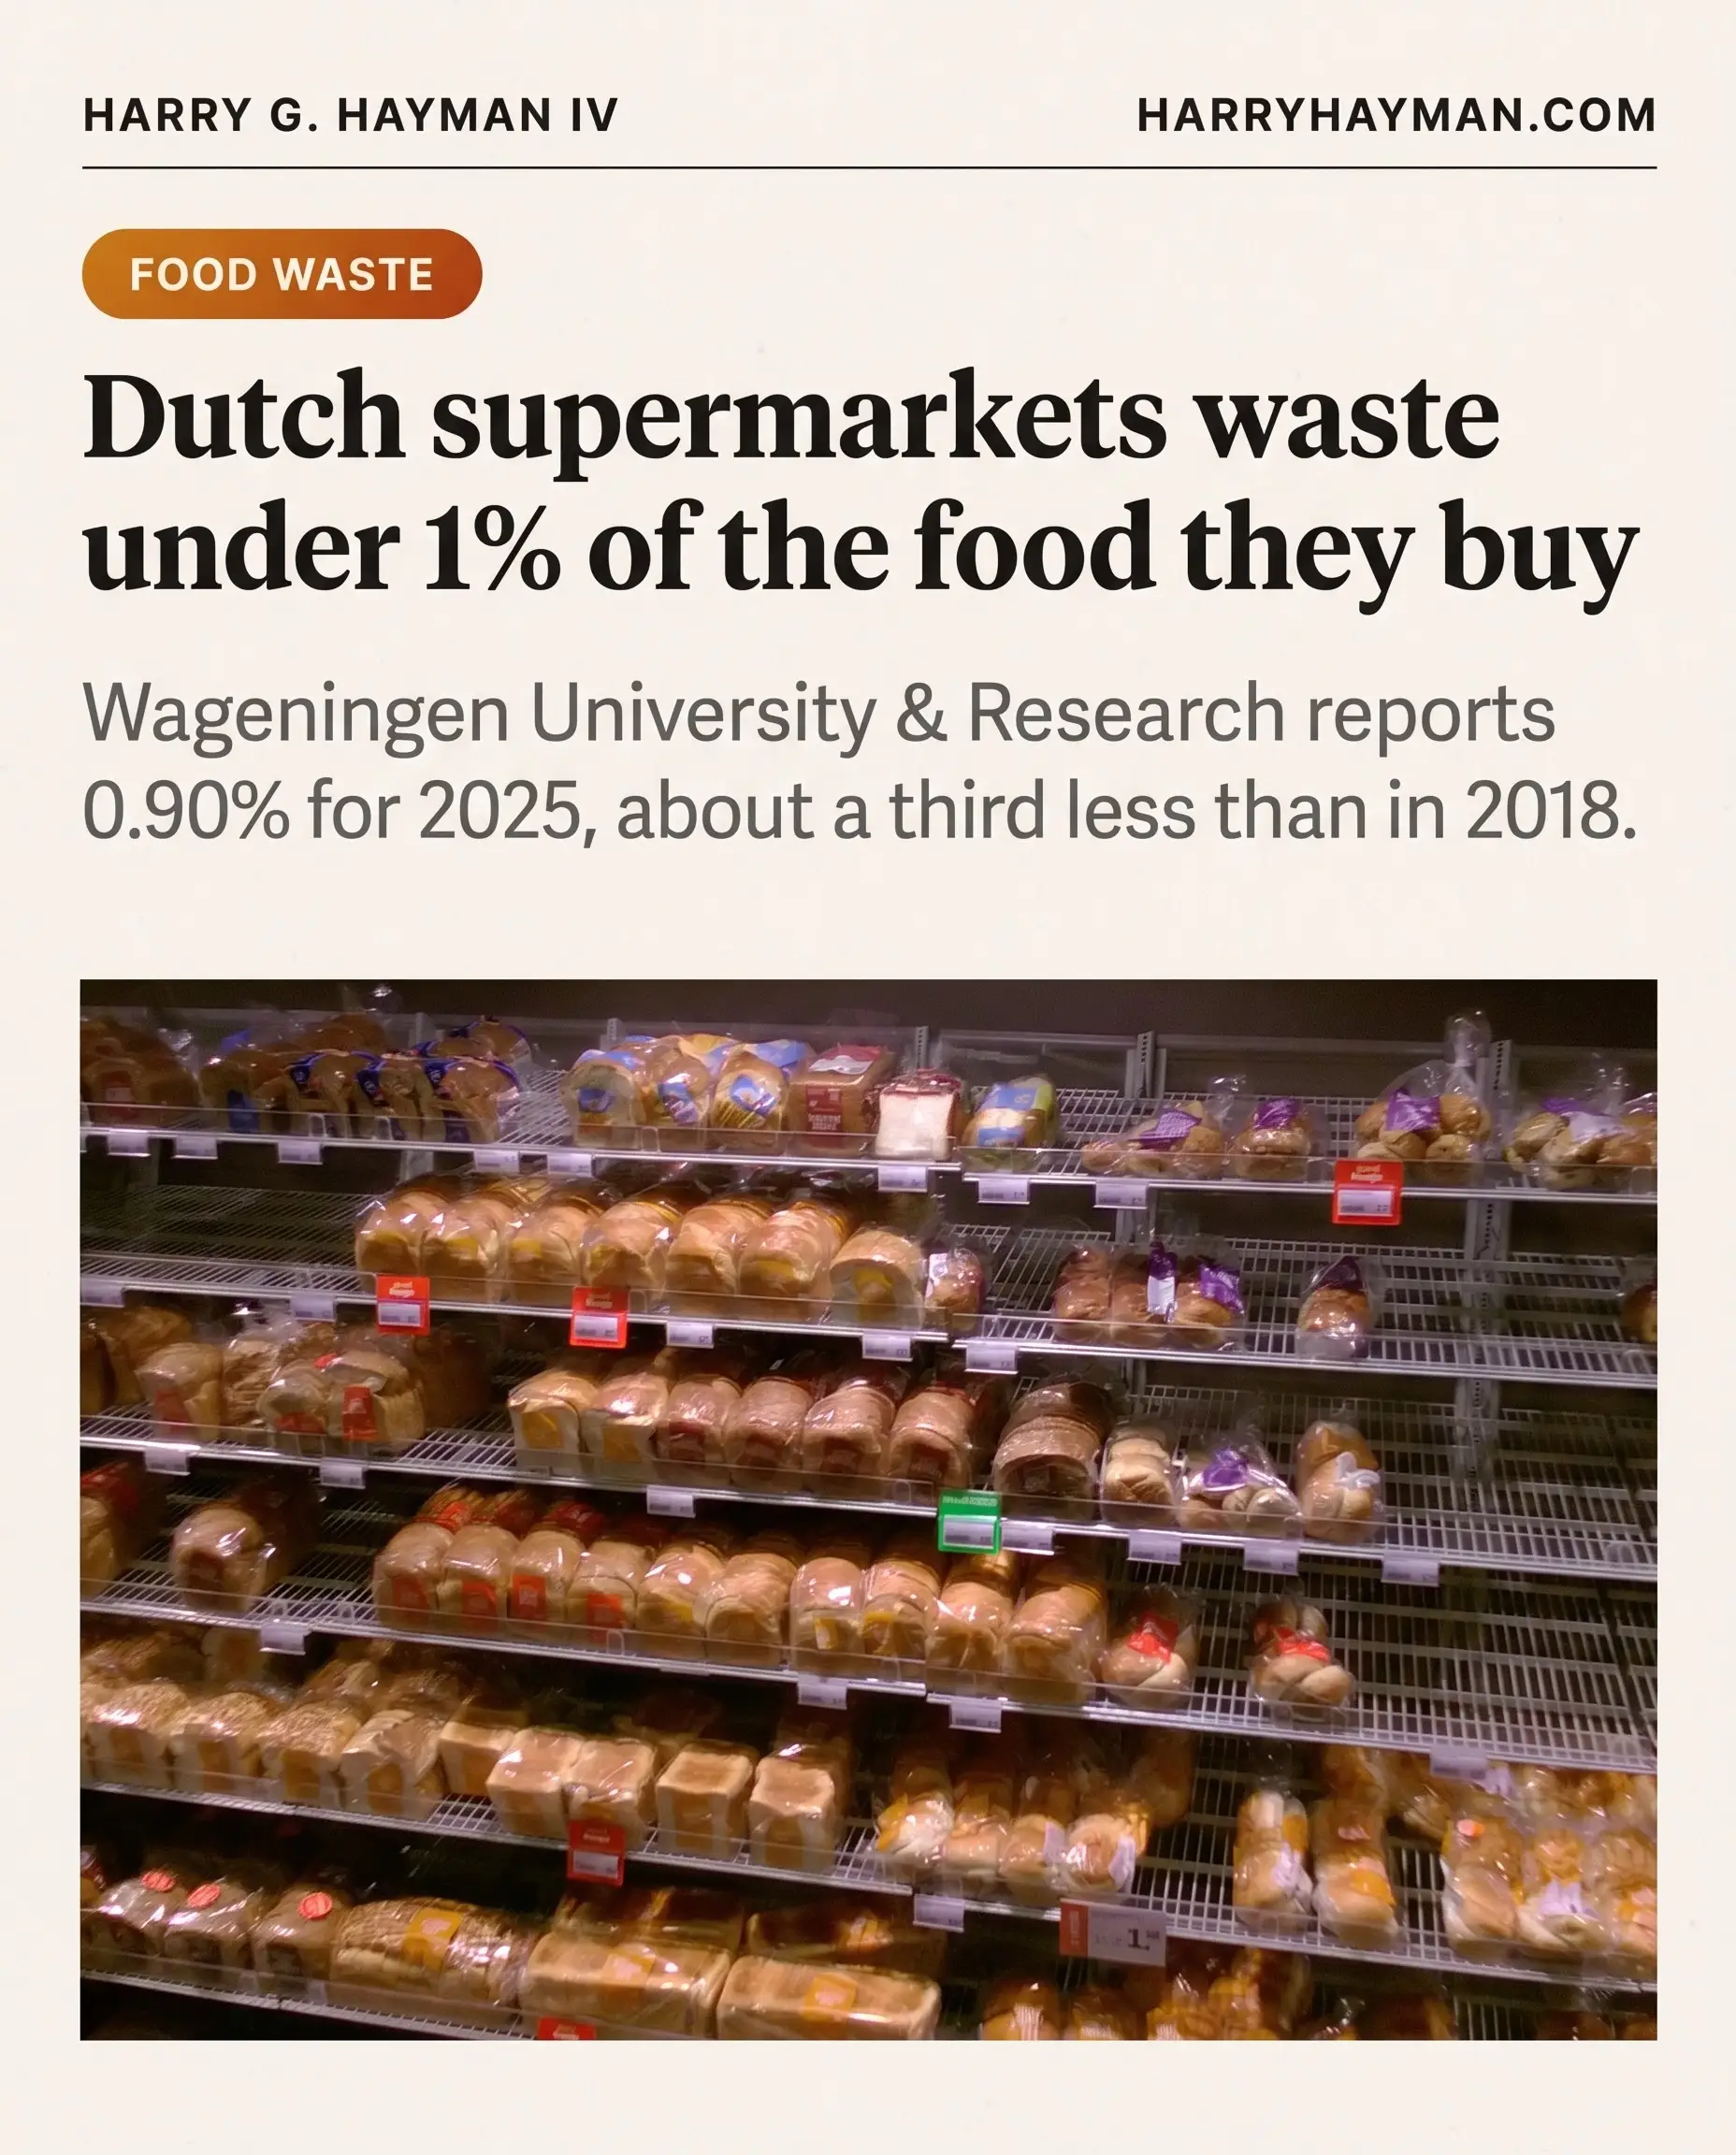
At eleven in the morning, a loaf of bread that did not sell yesterday is still on the shelf in a Dutch supermarket, and it costs 50 cents. That is how Albert Heijn described its yesterday’s bread offer when it rolled the idea out to every store in September 2021: unsold loaves from the day before go back on sale until 11:00 at a deep discount. I am Harry Hayman, I think about what Philadelphia eats and what it throws away, and that shelf made me ask a bigger question. How would anyone outside the company know whether such a trick works? In the Netherlands the answer is a number that a research university publishes, and I have spent time with it. It says Dutch supermarkets waste less than 1 percent of the food they buy. I want to be careful with that number, because the tidy version of the story is not quite the true one.
The Number Wageningen Publishes
The latest edition comes from Wageningen University and Research, known as WUR, and was published on 9 July 2026. It covers 2025 data and puts actual food waste, meaning food eaten by neither people nor animals, at 0.9 percent of what supermarkets bought. The full WUR report gives 0.90 percent of purchase volume, or 88.7 kilotonnes. The year before it was 0.92 percent, according to the foundation’s release on the 2024 data, and the 2023 figure was 0.89 percent.
Read those three numbers again and you will see the first thing the tidy version leaves out. The decline has stopped. WUR’s own words are that the reduction now appears to be levelling off, and the foundation behind the monitor called 2024 the first time the figure stalled.
Definitions matter here. A second, wider measure counts food that never reached a person, including what went to animal feed. That figure was 1.2 percent in 2025. The report’s method section explains that waste is measured as a share of purchase volume by weight, which it takes as sales plus losses, across stores and distribution centres. It includes inedible parts such as peels and eggshells, and drinks. So when I say under 1 percent, I mean waste in that strict sense, and I will not blur it with the 1.2.
How far has it come? WUR reports waste down 34.0 percent between 2018 and 2025. The report does not print the 2018 starting value in its text. Working backward from its own percentages, I get roughly 1.4 percent, and I offer that as my arithmetic, not as a published figure.
Who Counts, and How
I started with a suspicion that this was a government rule. It is not, and the details are more interesting. The annual study was initiated by a foundation called Samen Tegen Voedselverspilling, which translates as Together Against Food Waste, and by the Dutch retail association CBL, and the Dutch ministry of agriculture funds it. WUR does the analysis. The data come from the supermarkets themselves.
The 2023 release from the foundation says, in the original Dutch, that the chains report “op vrijwillige basis,” on a voluntary basis, and give their data to WUR in confidence. In 2025 eleven organisations took part, and WUR says together they account for approximately 90 percent of the Dutch supermarket market. The first edition, reported in March 2020 from the 2018 data, had five chains and about 77.5 percent of the market.
I want to be exact about what that means. The numbers are the chains’ own reports, checked by WUR against the previous year and for plausibility, and I found no description of an outside audit. That is still a large, regular, public number, and in my view it is worth more than a promise.
The Dashboard With Names On It
Here is the part I did not expect. The sector total keeps the chains anonymous, but the Dutch government publishes a separate Dashboard Supermarkten, built by Wageningen Social and Economic Research for two ministries, that shows food waste chain by chain. For 2024 it lists Albert Heijn at 0.89 percent of the volume it bought, against a sector average of 0.92. Picnic, the online grocer, sits at 0.46 percent and PLUS at 1.12. The dashboard says Albert Heijn, Dirk, Jumbo and Picnic present figures below the sector average.
Two cautions come with it. A large share of the data was supplied by the chains, and some bars include food that went to a food bank, to animal feed or to surprise bags, so they are not on the same footing as the others. The dashboard footnotes each of them. I find that honesty reassuring: a public scoreboard that explains where its own columns differ.
Bread, and What I Cannot Say
Bread is the biggest loss category in Dutch supermarkets, and it is where the figures are easiest to misuse. Across the whole sector, the CBL infographic shows bread, bakery and pastry losses falling from 7.7 percent of purchases in 2018 to 6.5 in 2023 and 5.8 in 2024, and WUR puts 2025 at 5.3. Those are sector figures. They are not one chain’s, and I will not pin them on Albert Heijn even though that chain’s discount bread is the example I opened with.
Now the claim I would love to make and cannot. It is tempting to write that the Dutch cut waste by a third because someone started publishing the number. The record shows two things happening in the same years. I cannot show that one caused the other. The WUR report credits better forecasting with artificial intelligence, discounts as a date approaches, yesterday’s bread and boxes of leftover products. The foundation’s director, Toine Timmermans, said in 2024, in my translation, that recent legislation such as the CSRD, which obliges large companies to report their impact, was among the reasons for the faster decline. That is a person with a stake saying so, and it points to reporting rules as one driver. I leave the weighing to you.
What the monitor does offer is a mechanism. The report notes that each retailer can compare its own figures with the sector benchmark. A CBL manager said in 2020 that to act in a targeted way, reliable data is essential. A number you can compare is a number you can chase.
What the United States Does Publish
For years I carried around the line that nobody in America publishes this. I was wrong, and the corrected picture is more useful.
Several big chains publish, each in its own unit. Walmart’s ESG page reports that it reduced its global food loss and waste intensity by 3.45 percent against a 2016 baseline, short of a 50 percent goal for 2030. Kroger’s performance tables report food waste generated in its stores in tons: 245,289 in 2022, 265,773 in 2023 and 319,720 in 2024, which moves its reduction against 2017 from 26.2 percent to 3.8. Ahold Delhaize, the group that owns Albert Heijn and also The GIANT Company in Pennsylvania, reports in its 2025 annual report a food waste reduction of 39.1 percent against 2016, in tonnes per million. Three chains, three units. You cannot lay them side by side.
There is also an industry benchmark. The U.S. Food Waste Pact, run by the nonprofits ReFED and the World Wildlife Fund, reports an unsold food rate of 2.90 percent for 2024. Its reporting signatories make up 54.4 percent of the retail segment, and the data are anonymized and aggregated, so no chain is named. Its first national retail data arrived on 31 March 2025, and the rate it gave for 2023 was later restated, which tells me a young series is still being refined.
ReFED’s retail fact sheet says retail generated 3.98 million tons of surplus food in 2024, 5.7 percent of the total, and that 2.72 million tons of it became waste. Please do not set any of this against the Dutch 0.90 percent. The Pact’s rate counts food that was later donated or sent to animals; the Dutch waste figure does not. And ReFED’s headline that about 29 percent of food goes unsold or uneaten covers the whole chain from farm to home, not the store. I found no like for like comparison anywhere, so I will not make one.
So the honest contrast is not that Americans hide it. Champions 12.3 wrote in 2024 that most companies do not report food loss and waste publicly, and that no national government has yet required businesses to do so, which covers the Dutch as well. The difference is narrower. The Netherlands has one definition, one sector number for about 90 percent of the market, and a dashboard with names. We have good reports in different units.
What I Would Count in Philadelphia
Our own numbers start at home. In the City’s 2017 waste characterization study, food was 16.7 percent of residential waste, the largest single category, as shown in the Streets Department’s waste plan. The Office of Sustainability says nearly one fifth of the residential stream is wasted food. That plan also says about 72 percent of the city’s municipal waste in 2018 came from commercial sources, and that is the part grocers sit in. I found no composition figure for it.
Pennsylvania has no organic waste ban or recycling law that bears on food waste, according to ReFED’s policy finder, last updated in August 2026. In September the City announced a zero waste plan that includes a privately funded composting facility and says the administration is investigating the expansion of municipal food waste reduction. That is a plan and a bill, not a rule for grocers, and I have not seen the bill pass.
I do not know what a Philadelphia scoreboard should hold. I do know what the Dutch example asks of a city: a shared definition, a denominator everyone can check, participation that is voluntary but visible, and names in public where the chains agree. Food is infrastructure, and infrastructure gets inspected. So here is what I keep asking: if Philadelphia’s grocers agreed on one number, would we rather count it before we argue about what to do with it, or after?
Photo in the poster: Donald Trung Quoc Don, Wikimedia Commons, CC BY-SA 4.0.
Sources and references
- Albert Heijn: yesterday’s bread, September 2021
- Wageningen University and Research: supermarket food waste news, 9 July 2026
- WUR report on 2025 data: Monitor Voedselverspilling
- Samen Tegen Voedselverspilling: supermarket food waste 2024 release
- WUR report on 2024 data, hosted by CBL
- Duurzaam Ondernemen: Dutch supermarkets make food waste visible, March 2020
- Dashboard Supermarkten: Voedselverspilling
- CBL infographic: retail figures 2024
- Walmart ESG: waste and circularity
- Kroger 2025 Responsible Business performance tables
- Ahold Delhaize annual report 2025
- U.S. Food Waste Pact 2025 data report
- U.S. Food Waste Pact: first national retail data, March 2025
- ReFED retail fact sheet, 2024 data
- ReFED 2026 U.S. Food Waste Report
- Champions 12.3: 2024 private sector progress update
- City of Philadelphia Streets Department: Municipal Waste Management Plan
- City of Philadelphia Office of Sustainability: Eat Away at Food Waste
- ReFED Policy Finder: Pennsylvania
- City of Philadelphia: Zero Waste initiative announcement
About the Author
Harry Hayman is a Philadelphia-based entrepreneur, music producer, and cultural advocate. Through his work with the Feed Philly Coalition, he explores and documents the creative, culinary, and civic life of a city he believes is one of the most inspired places in America.